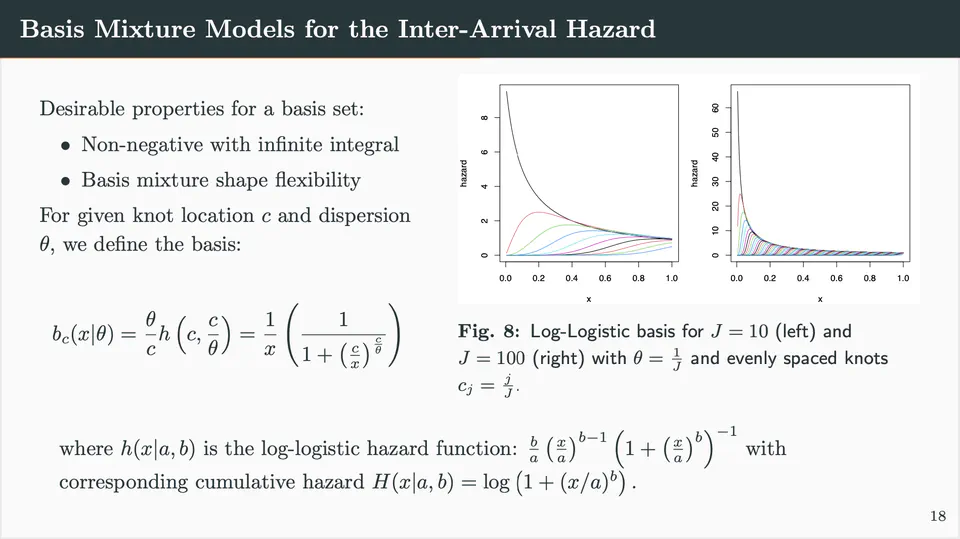
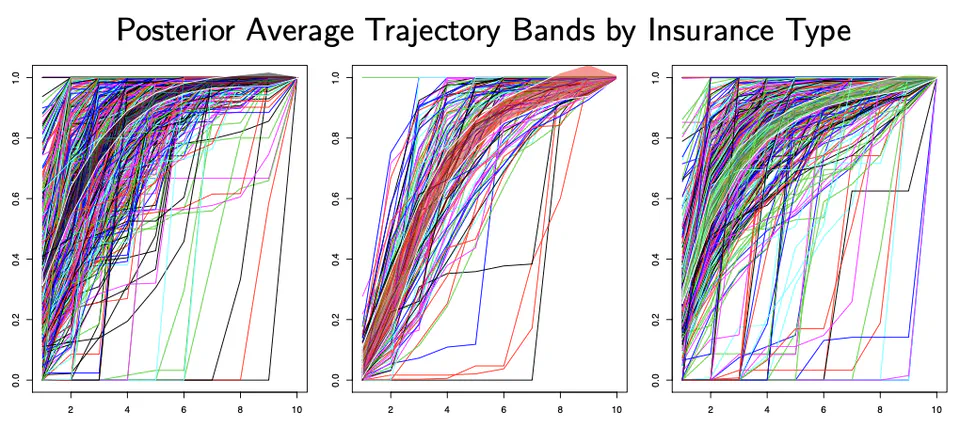
Recurrent event modeling is like the estranged point-process cousin who lives on the outskirts of survival analysis. Maybe that's an odd analogy, but it rings true in my experience. This poster was presented at the 2022 ARCS Symposium meeting, an event that honors ARCS Foundation donors and highlights the work of ARCS scholars.
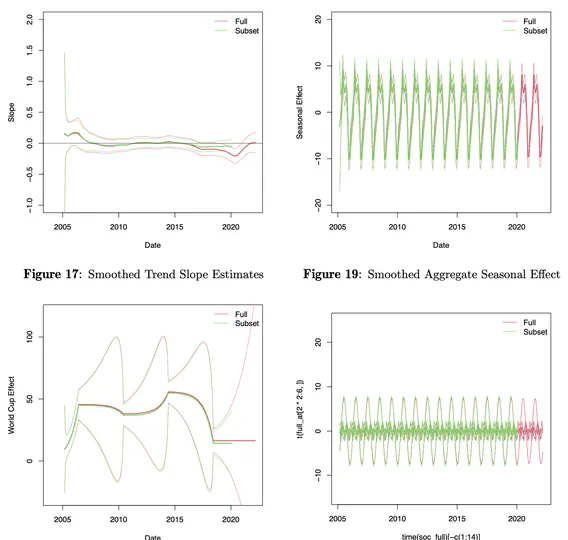
Time-series was one of the last classes I took in my PhD. I'm not going to say it was like therapy, but it sure felt nice to end on a high note.
Have you ever finished giving a 45 minute presentation and thought, "I wish I had more time"? I'm not sure whether that's a good thing or a bad thing, but at least my family said nice things.
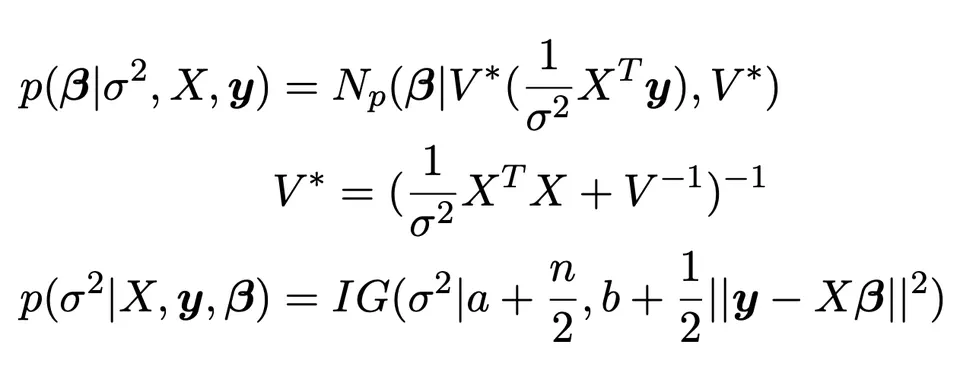
Using height to demonstrate correlation is, well, super cliche and I'm definitely guilty of using it when teaching intro stats students. So imagine the irony I felt when I realized that my two-day take-home PhD qualifying exam was on modeling heights of all things.
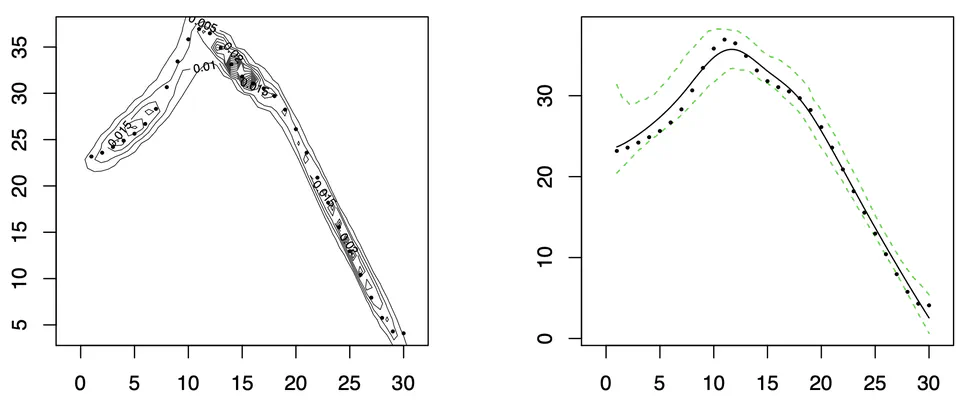
Functional data is really interesting, to me anyway. So similar to vector data, yet it exists in a very different space. I completed this project for a Bayesian nonparametrics course during my PhD.
Risk management is a fascinating field. The models are interesting and, more importantly, actuaries are some of my favorite people. They have a certain nerdy panache that I find both endearing and relatable.
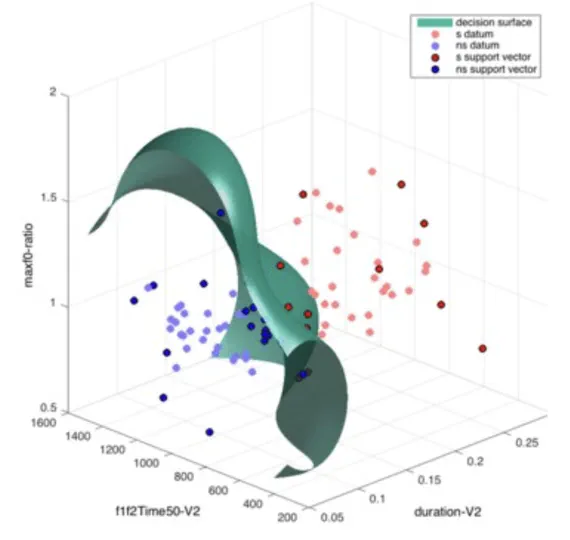
Machine learning algorithms sometimes feel a bit like using a fork-lift to hang a picture. Sure it can work, but you have to be careful, like, really careful. This project was my first substantive foray into machine learning models for image data.
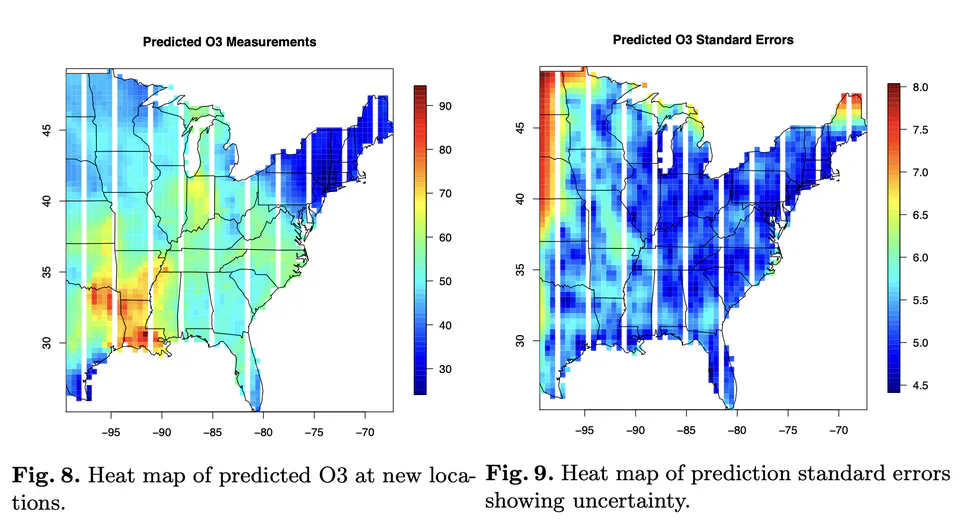
Spatial analysis makes some lovely graphs, doesn't it? The problem is that the datasets can be huge, which really forces you to ackowledge the practical side of model building. This project was a two-day take-home exam for an applied modeling course during my master's.
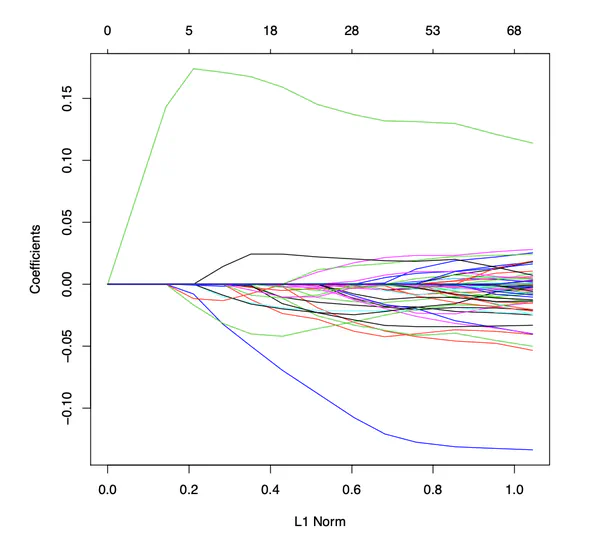
I've been studying statistics for the better part of 10 years now and I still can't tell you what LASSO stands for. Least absolute shrinkage and selection operator? Seems like a stretch.